This analysis tool is able to create a density surface from both point and line features. Values of this density surface are greatest around the location of points and diminish with increased distance from these same points. It can be utilized as a method of making inferences about a larger geographic area based on a finite data sample.
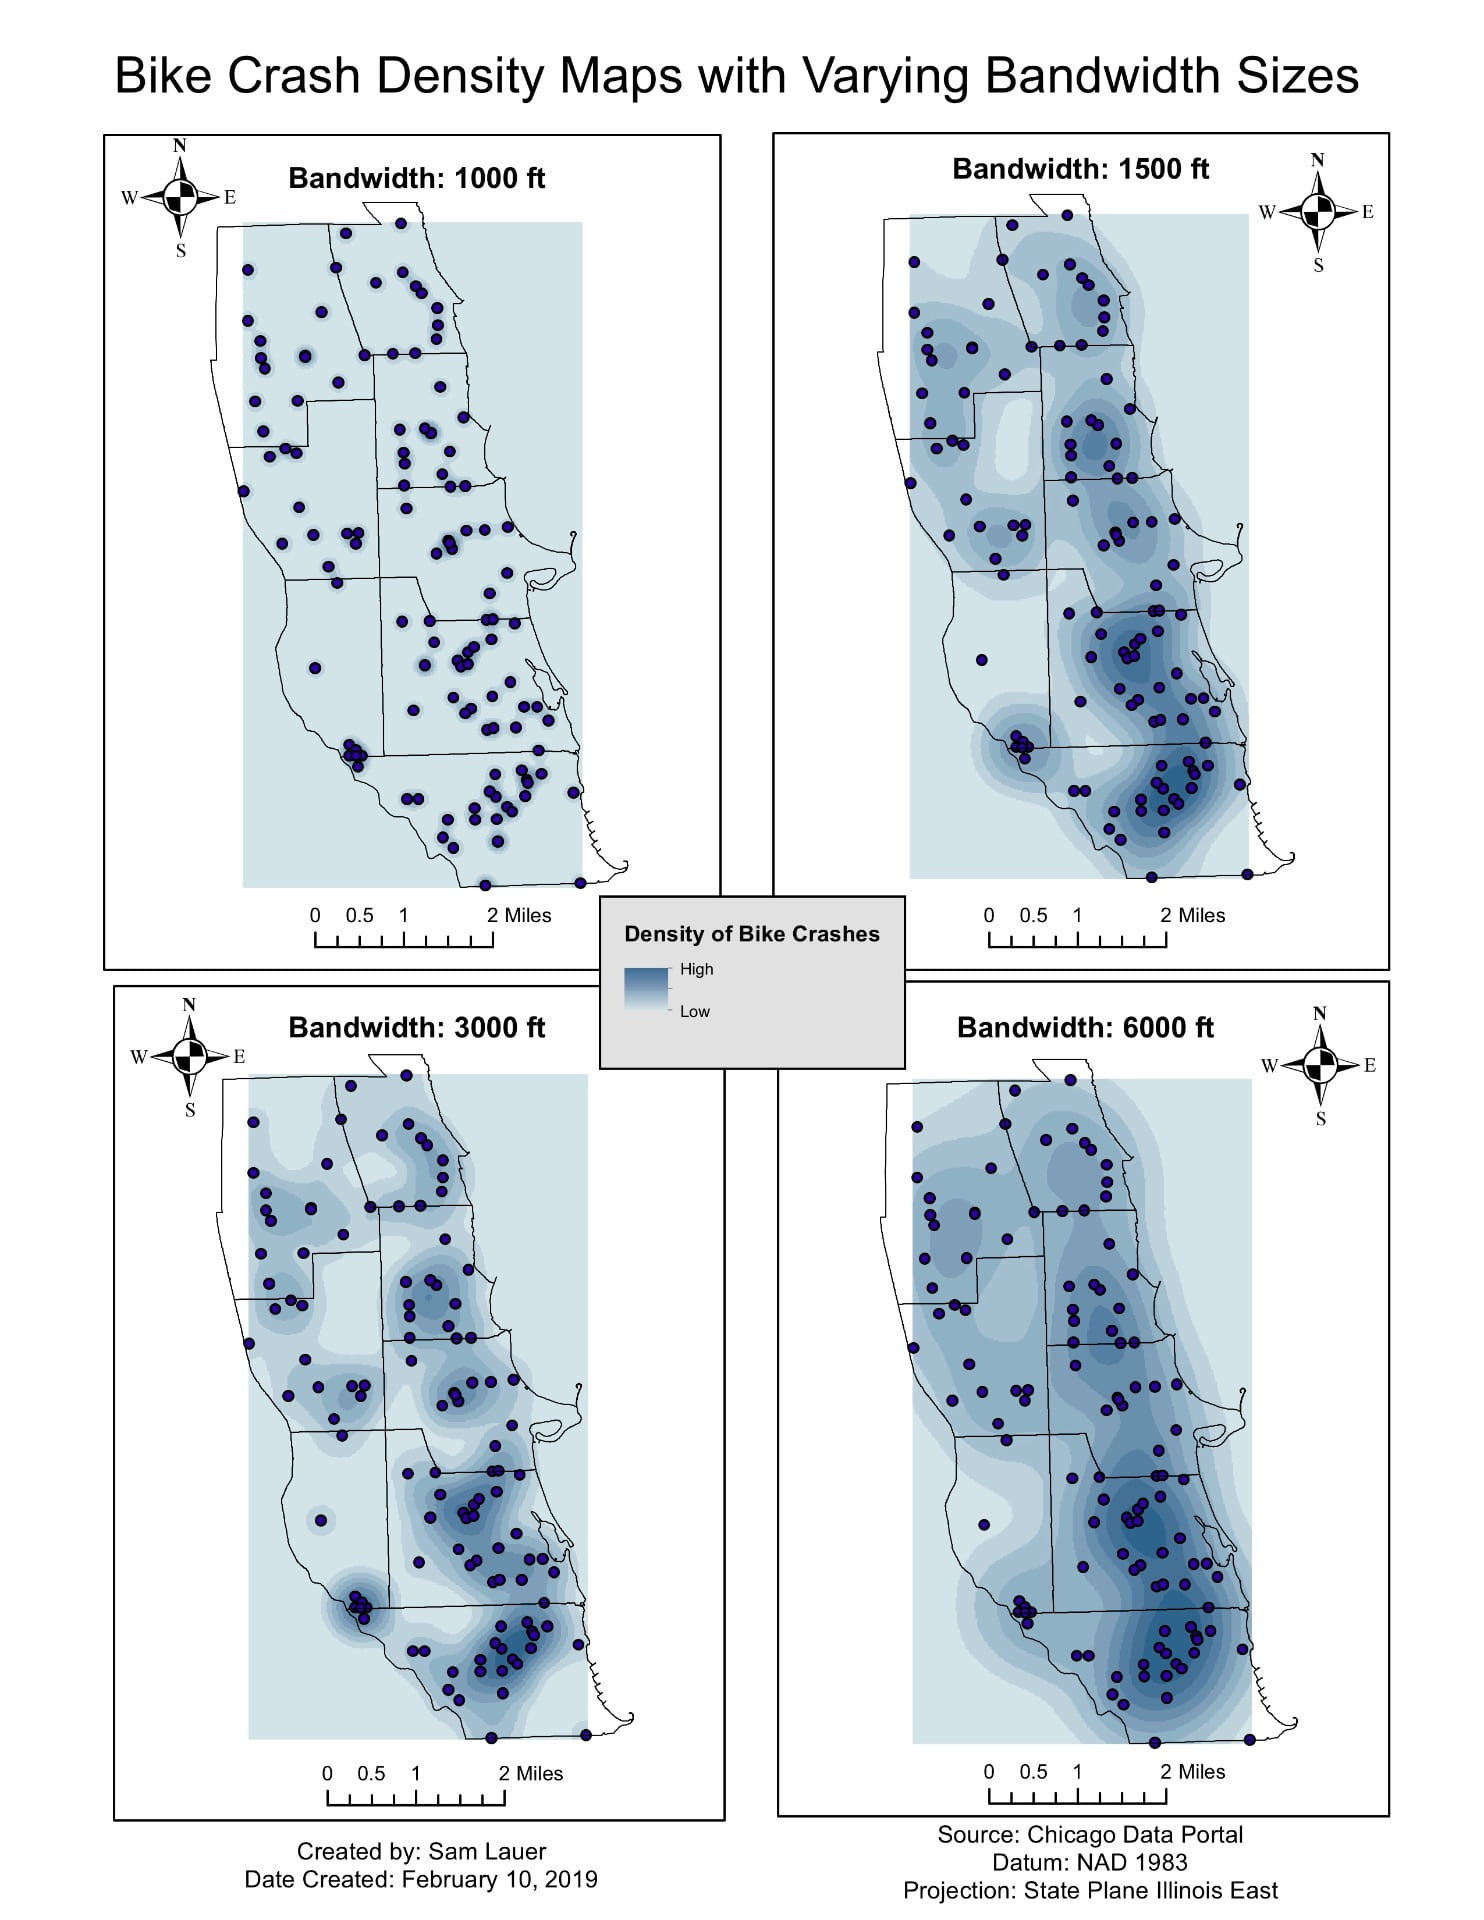
How can this be utilized in the real world? Let’s use the map below showing bicycle crash data along with varying bandwidths of distance. Using kernel density, the map is able to illustrate geographic areas in northern Chicago that have a high density of bicycle crashes. Urban planners may be able to utilize this data to more closely look at the region and analyze characteristics within the design of the local streetscape that might be contributing factors in these crashes. Are the crashes due to higher speeds? Lack of bicycle infrastructure? Once the factors are identified, the street design can be changed in order to mitigate future crashes from occurring thus making them safer for bicycle traffic.