Hot Spot Analysis is a spatial statistics tool that calculates the Getis-Ord Gi statistic for each feature in a dataset. Each feature is measured within the context of neighboring features. If, in this comparison, a local sum is different than expected and the difference is not the result of random chance, a statistically significant z-score is the result. The resultant z-score will tell the reader where cluster features have either a spatially high value, i.e. “hot spot” or low value, i.e. “cold spot”.
You can also conduct further analysis by using temporal data to find emerging trends that can visually demonstrate patterns in the data. These patterns might demonstrate that a certain area is an intensifying hot spot or an intensifying cold spot.
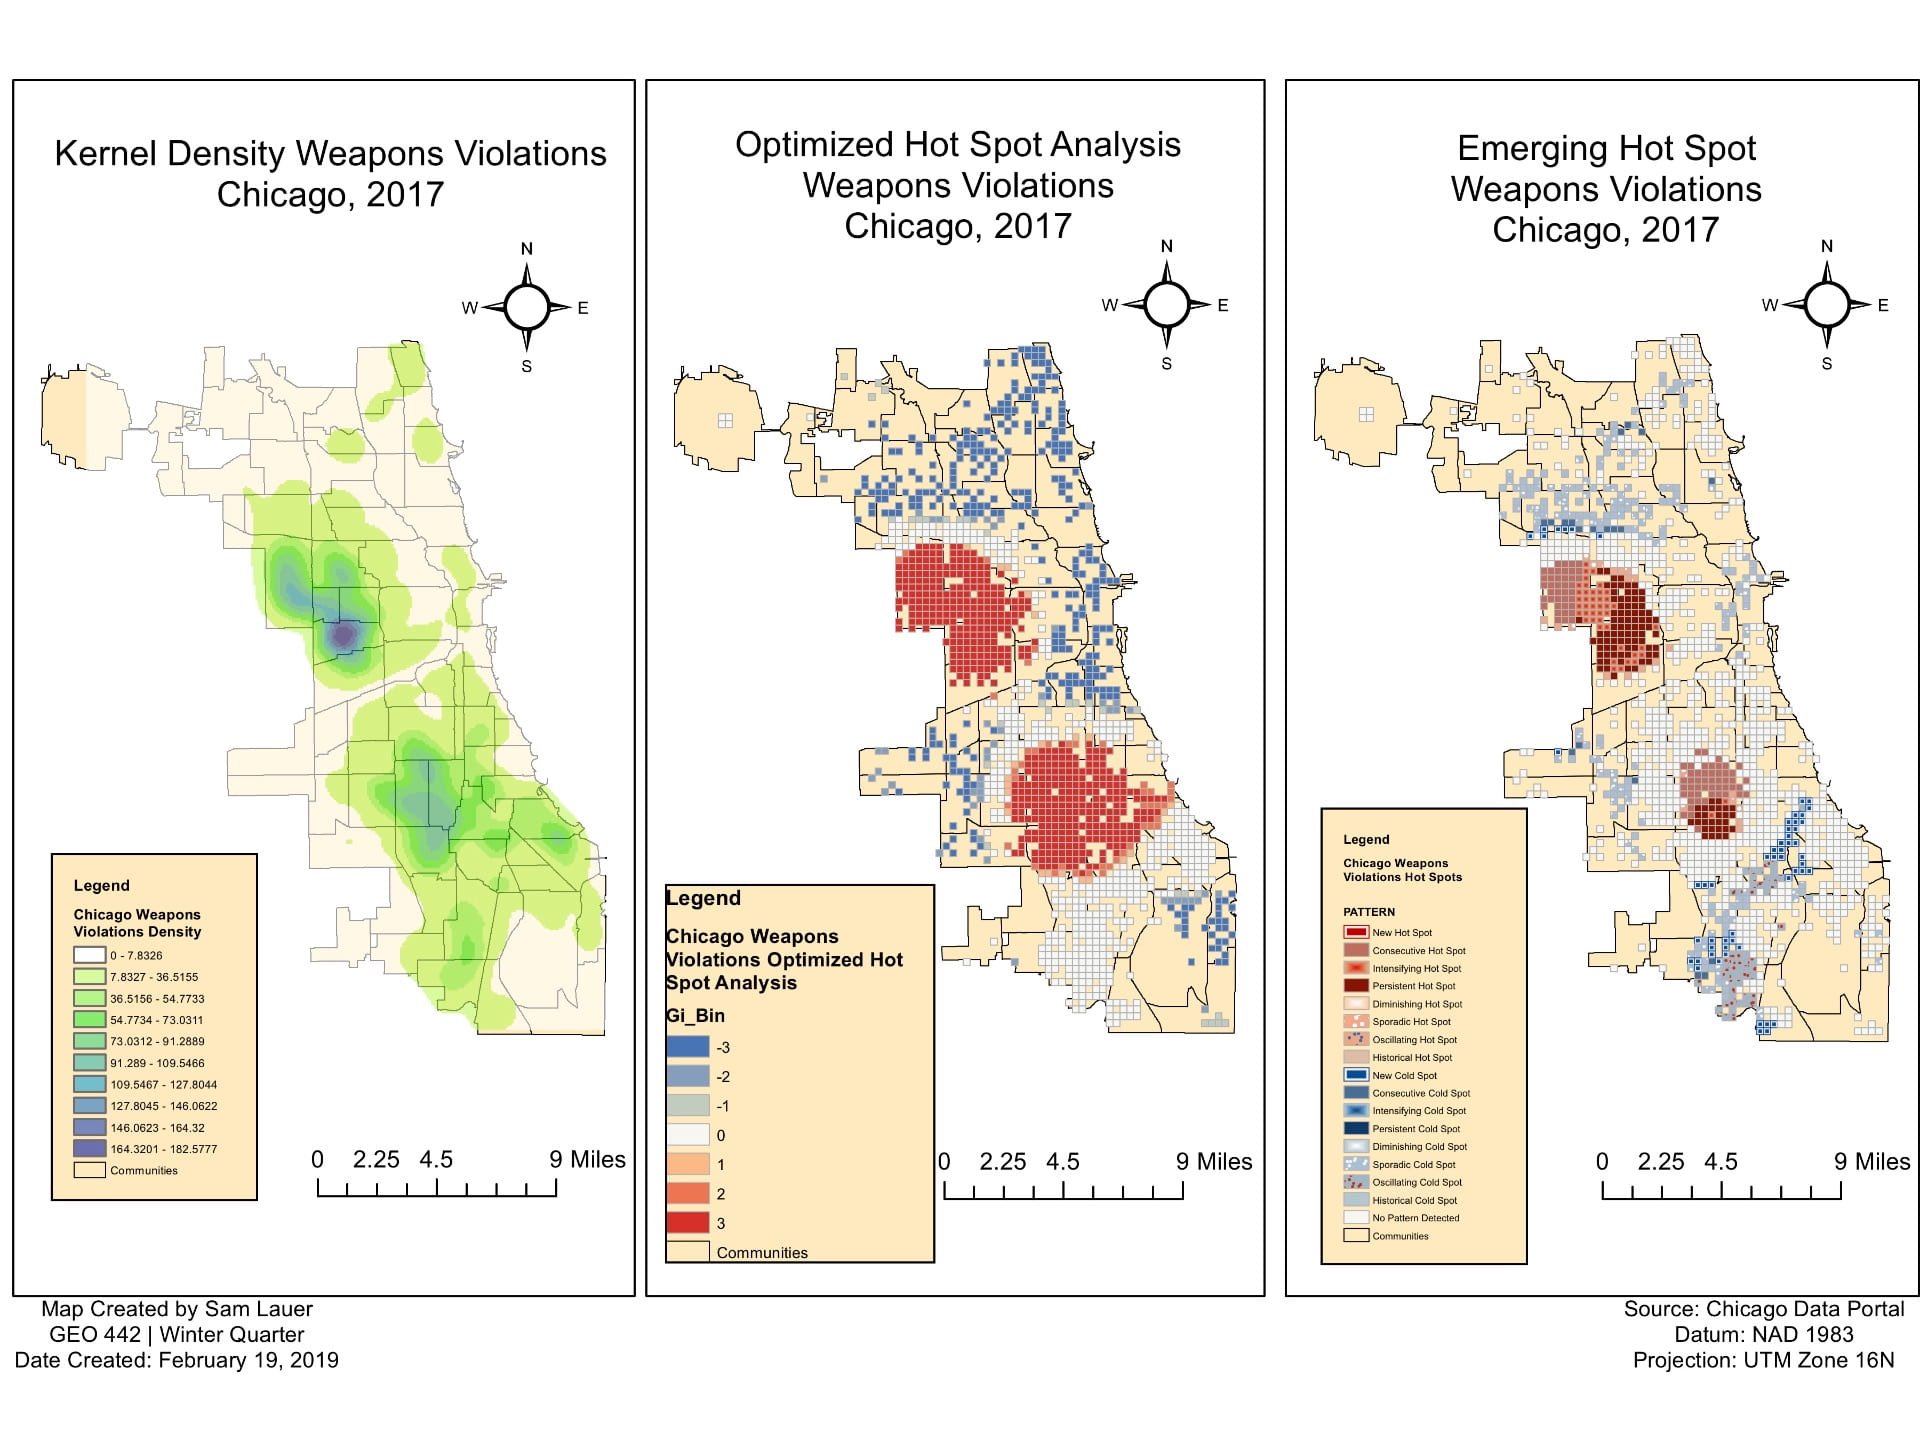
The maps below demonstrates how one can apply these tools to weapons violations data in the Chicago area. They demonstrate where higher and lower concentrations of weapons violations occur within the city as well as where violence is getting worse or improving over time. This information can consequently be utilized to help community groups and/or police departments more effectively allocate their resources in order to help minimize violence within the respective communities.
Source: Esri