For many of the graduate students active with the Chaddick Institute, the city’s famous “Loop” district is their preferred place to work, recreate, and socialize.
When we think of the factors that make this area so inviting, we usually don’t think of cardboard boxes, dumpsters, narrow alleyways. Yet the Chicago Loop Alliance has combined all three to make an interesting and memorable series of events called ACTIVATE.
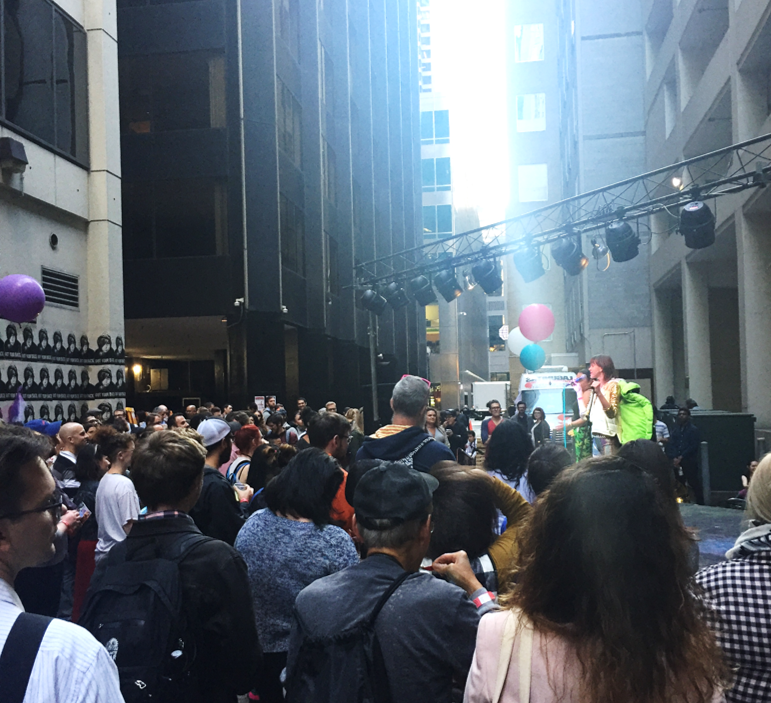
I had the opportunity to check out the last ACTIVATE event of the year with a group from Chaddick. “Simple, strange, chaotic, and eccentric” are all the words I’d use to describe the atmosphere. Being from a rural town in Michigan, I must admit I was a bit out of my element. At one point, we were quite literally dancing next to a row of empty garbage bins! Although I was a fish out of my pond, I almost instantly found an appreciation for why these types of events are all the rage in many major cities.
These event series turn alleys into creative spaces to exhibit the vast array of art that this city has to offer; they also bring together people to interact with this home-grown art face-to-face. The theme on this night was waste; hence, the dumpsters and cardboard boxes were everywhere.
Our group – all graduate students from the School of Public Service and Sustainable Urban Development programs– took advantage of the towers of cardboard boxes. With teamwork and creativity, we created a rather large transformer who loves to give free hugs! We amazed bystanders who even asked for a coveted photo-op with our giant cardboard creation. We study policies, public service, and urban planning, but we can harness our inner child and build things too!
Amidst the chaos and business of the city there is a rare and underappreciated beauty—people of all ethnicities, cultures, ages, orientations, and interests can come together in an alley and simply enjoy the oddity and excitement of socializing among strangers…and, well, dumpsters. This event brought it back to its most beautiful state of simplicity.
What were some key takeaways?
Chicago has some impressively creative artists, not to mention some surprisingly clean alleys.
Somehow, the Chicago Loop Alliance was able to transform an ally – dumpsters and all – into a museum, a dance floor, a bar and a playground all in one.
Our School of Public Service students’ innovation was on full display, using cardboard boxes to build our own creation.
In the bigger picture, the event provided me new insights into how these events can give cities a new dimension. Buildings can only be built so high and new parks can only achieve so much. Who would have ever thought that an alley could be used as an art exhibit, a bar, and a creative space? I applaud CLA for thinking “out of the box”.
Cheers to the Chicago Loop Alliance for identifying and capitalizing on such hidden potential – check out their website to find out more, and keep an eye peeled for next summer’s events!
By C. Scott Smith, Assistant Director, Chaddick Institute, and Riley O’Neil, graduate student
One of the major advantages of living in Chicago compared to other US cities is having access to a broad range of transportation options. The proximity of homes and workplaces to public transportation routes has contributed greatly to the success of Chicago’s transit system, which now handles about 600 million passenger trips each year. We estimate that 1.1 million (close to 100% of total) workers and 1.3 million (about 98% of total) jobs in Chicago are within ½ mile of a bus stop or rail station.
For people with disabilities, however, access to public transportation can be limited. Chicago’s enormous system of commuter rail lines, elevated rail/subways, and bus routes—not to mention other “shared use mobility services” such as e-scooter sharing, bikesharing, carsharing and ridesourcing (via Uber and Lyft, for example)— do not always accommodate people who experience disability situations (e.g., passenger traveling via wheelchair or with stroller attempting to access transit via train station without an elevator). This blog summarizes key accessibility gaps working people with varying abilities face in Chicago’s public transportation system.
Accessibility of Chicago’s rail stations
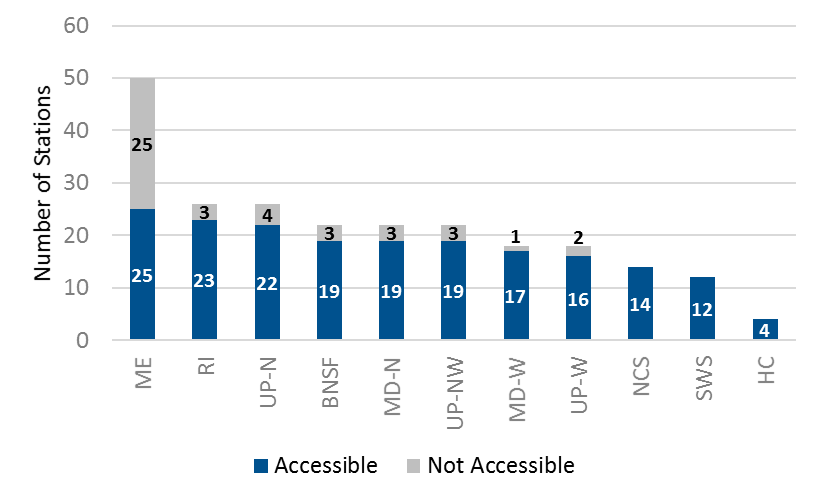
A simple way to gauge access for people with varying abilities is to tally the share of rail stations that fail to accommodate people with mobility limitations. Presently, close to 20 percent (192) of all Metra commuter rail stations (239) and 33 percent of all ‘L’ stations are not fully accessible, or do not support wheelchair boardings. The following figures show the proportion of stations for each Metra and Chicago Transit Authority ‘L’ line that is (not) accessible. On Metra, only three of the eleven commuter lines offer full accessibility and only half of the stations on the Metra Electric, in particular, have facilities that accommodate people in wheelchairs. On the CTA, access on the Brown, Green, Pink and Yellow Lines is much better than that on the Red and Blue Lines.
Proportion of CTA ‘L’ Stations that are Wheelchair Accessible by Line
Data sources: CTA website and GTFS data
Proportion of Metra Stations that are Wheelchair Accessible by Line
Data sources: Metra website and GTFS data
This is not to say that these major transit operators have not taken steps toward making their infrastructure more accessible. According to CTA, when the Americans with Disabilities Act (ADA) passed in 1990, only 6 percent of the agency’s rail stations complied with the legislation’s design standards; efforts by the agency over the past several years have grown this number to 67 percent. Further, just last year the CTA announced its All Stations Accessibility Program (ASAP), which aims to make the entire rail system accessible by 2036. However, such changes could not come too soon for many of the area’s visitors and residents with physical, cognitive and sensory limitations who experience difficulties traversing by private automobile; which is still the dominant mode of travel within the Chicago region.
Working age people experiencing disability
Making the transition toward a regional ADA compliant public transit system is especially important for Chicago’s working age population experiencing disability. Recent census data indicates that about 53.5 percent of people who have self-identified in the census as having limited mobility in Chicago are of working age; that is, between 18 and 64 years old. And while nearly 50 percent of people with disabilities over 25 years of age have at least some college education, only 19.1 percent are employed and only 24.7 percent participate in the labor force. Further, more than half of workers reporting a disability worked less than full time (compared to 34.2 percent for their counterparts who reported no such limitation) and earned 30 percent less than those who did not report a disability (American Community Survey, 2015).
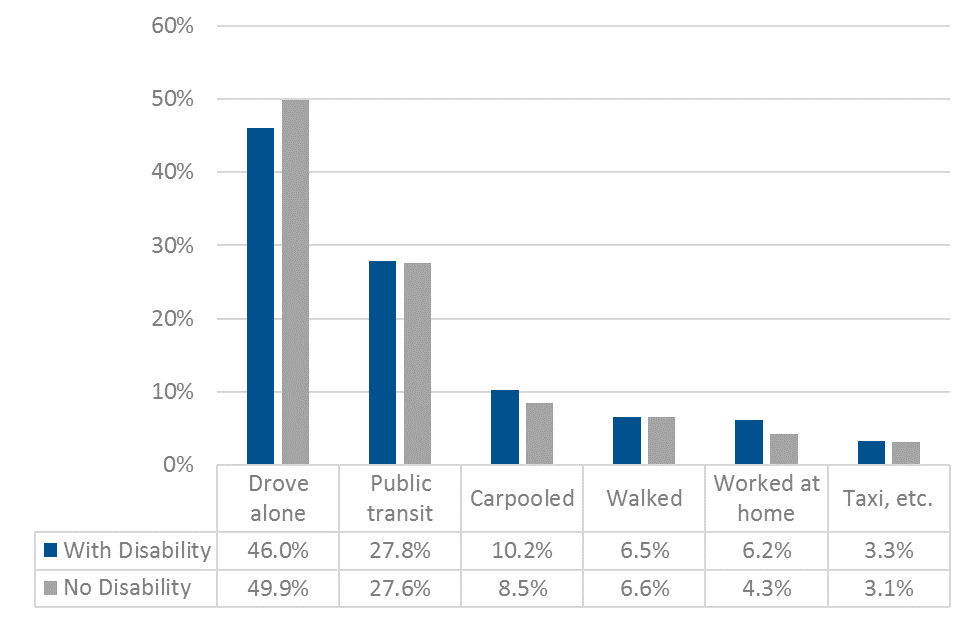
Previous research has shown that public transit is an important way to improve labor force participation among people with disabilities in part because it tends to be more affordable and accessible than other modes, especially private automobile. For adults with disabilities, lack of adequate transportation is one of the most frequently cited reasons for being discouraged from looking for work. As the table below shows, people with mobility limitations in the City of Chicago tend to use shared modes (such as public transit, taxi and carpool) more than other workers, albeit slightly. People with mobility limitations also work from home more than those who reported no such limitation.
Data source: US Census Bureau, American Community Survey (Table S1811) 5-year estimates for the City of Chicago, 2011-2015
Estimating public transit employment accessibility for people with limited mobility
I used a variety of data sets to identify public transit accessibility gaps for working people with mobility limitations in the Chicago area. Most important were the public transit routes and schedules derived from general transit feed system or GTFS datasets provided by the three major service operators, Metra, CTA and Pace Suburban Bus. (It should be noted here that Pace’s GTFS data do not include information about wheelchair accessibility so, for simplicity sake, we assume that all 23,457 Pace bus stops in the dataset accommodate wheelchair boarding.) Employment distributions for all 2,014 census tracts in the metropolitan Chicago area were made available from the US Census Workplace Area Characteristics Longitudinal Employer-Household Dynamics dataset.
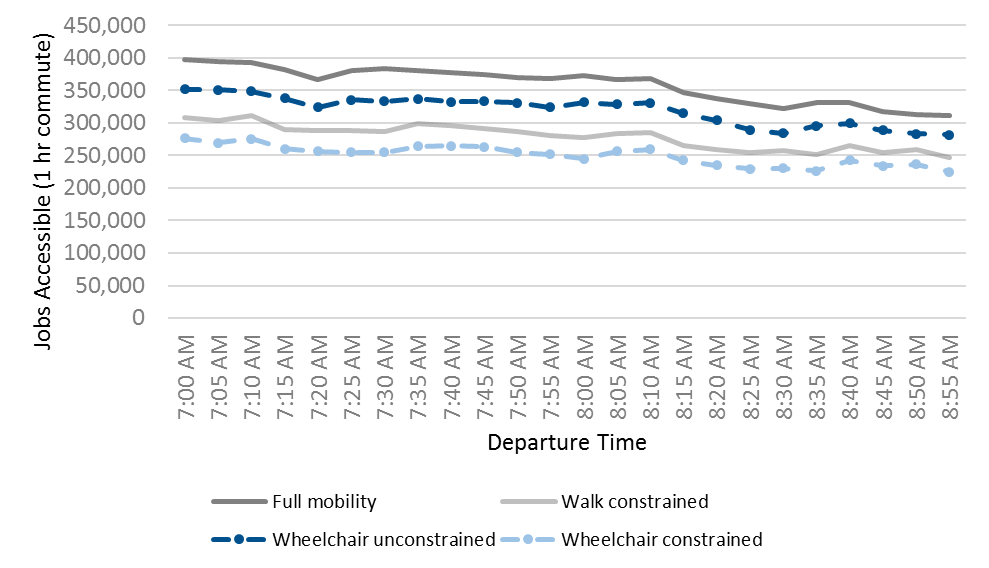
The employment accessibility estimates calculated as part of this research were also evaluated with respect to four scenarios, each representing a unique commuter mobility profile that is sensitive to maximum desired walking distance, average walking speed and whether commuters require wheelchair boarding accommodations. The estimates correspond to the average number of jobs that can be reached in a one hour journey during the peak morning commute period (i.e., 7AM-9AM at five-minute departure intervals) for each of the below profiles across Chicagoland.
Scenario
Assumptions
Full mobility
Worker walking at 3 mph pace a distance of up to one mile
Walk constrained
Worker walking at a slower 2.1 mph pace up to ½ mile
Wheelchair unconstrained
Worker with wheelchair traveling at a 3 mph pace of up to one mile
Wheelchair constrained
Worker with wheelchair traveling at a slower 2.1 mph pace up to ½ mile
The figure below shows that merely being constrained by the speed and distance in which one can walk can substantially reduce the number of jobs that can be reached. The walk constrained model reduces average job accessibility by 22.3 percent, while the lack of wheelchair reduces it by 30 percent. Clearly, as mobility becomes more constrained, job opportunities dwindle. Making matters worse, the number of jobs reachable diminishes for all transit users when you are not traveling during. This is especially problematic for mobility constrained individuals who are more likely to work part time, have flexible hours and, therefore, may not always benefit from the higher frequency public transit services during the morning and evening rush.
The average percentages I provide above are for the morning peak period. To show this variability across different times of day, I created an animation comparing job accessibility for the full mobility and wheelchair constrained scenarios mentioned above starting at 7AM from the close-in community of Forest Park. This animations shows the job areas that commuters can reach by walking and using all types of public transit in a one-hour period.
This animation shows the job areas reachable within an hour by a fully mobile worker (shown in blue) and wheelchair constrained worker (shown in orange) by public transit. This difference in number of jobs reachable is often more than 100,000 depending on departure time.
Fortunately, there is growing awareness that our present transportation system is inadequate for a growing share of the population. Station/stop improvements, assistive technologies, Universal Design, Complete Streets and travel training are just a short list of efforts that are improving pathways to transit access for all people. Check back in a few months as we report more results on this issue. I welcome comments on this blog post, our first on this topic!
The spectacular rise of Lyft, Uber and other “ridesourcing” companies is changing how people get from place to place in large cities like Chicago. With a few clicks on your smartphone, and for a pre-determined price, you can arrange a ride with minimal walking and only a few minutes of waiting.
Many observers are understandably concerned about how ridesourcing is affecting public transportation. In this post, I’ll share some of my personal experiences and encourage readers to post comments about how your transportation behaviors might be changing in this new era of mobility options. I hope this serves as a useful demonstration about the complexity of this issue.
Using a TNC is as easy as a few smartphone clicks and often reduces wait times and walk distances for travelers.
Transportation Network Companies (TNCs) – as Lyft, Uber and other similar companies are called – can be either substitutes for, or compliments to, public transit, depending on the situation. Travelers can, for example, use TNCs instead of buses and trains, or they can use them to achieve transit-oriented, “mixed-mode” lifestyles, which likely include bikesharing, carsharing, and/or ridesourcing. In the latter case, particularly when people avoid car ownership, the existence of TNCs often encourages people to use transit more.
With this in mind, I’ll share three brief anecdotes about how ridesourcing is changing my travel:
Case #1: Not unlike many other Metra users, I often face “schedule anxiety” about catching a late-night Metra train. After teaching an evening class on DePaul’s downtown campus, for example, I know that missing my train – perhaps to help a student – requires me to wait a full hour for the next one. That means I don’t arrive to my house in Flossmoor until 11:30 p.m. For years, I found myself driving to campus at least once a week to avoid this painful scenario.
“Schedule anxiety” on Metra can be alleviated with the complementary use of TNCs.
But this is no more. Now, if I miss the Metra after class, I’ll catch a CTA Red Line train to the end of the line (95th Street) and summon an UberPool to get home. Problem solved for an extra $20. I now take Metra more often and rarely drive downtown on nights I’m teaching a class.
Case #2: When I need to make a “trip chain”, perhaps involving stopping at the DePaul campus, followed by, say, a visit to Navy Pier or Northeastern Illinois University’s campus, I used to find the compulsion to drive overwhelming, even though each stop is accessible on transit. However, with ridersourcing, I am now more likely to give transit a try, and if I fall behind in my schedule, I’ll spend a few extra dollars for a TNC. For these types of trips, too, I actually use transit more.
Case #3: When I need to make quick trips between campus and nearby downtown locations, however, TNCs are now replacing some of my transit trips – especially those that would involve a good bit of walking. Now, perhaps a third of the time, I’ll use TNCs; when another person is with me, I’ll turn to Uber or Lyft even more frequently. For the convenience of door-to-door service, the cost of around $5 each way is nearly impossible to pass up.
These examples show, in my case, that ridesourcing has been both a substitute for, and complement to, public transit, depending on the situation. I use Metra more and the CTA slightly less on downtown trips, but more on longer trips. Overall, I’m using transit slightly more than I did before TNCs.
I suspect that your story may be much different. Leave a comment to let us know how your transit usage has changed – or not – with the rise of ridesourcing! Also, be sure to check out our 2016 study, Have App Will Travel, comparing travel times, cost differences, and other factors that influence travelers’ decisions to take UberPool versus the CTA.
By C. Scott Smith, Assistant Director and Riley O’Neil
Chicago’s reputation as a “bike-friendly” city seems to grow stronger by the day, but many people still have only a vague understanding of why this reputation is so well-deserved. While some point to the city’s Bloomingdale Trail (or The 606) and Divvy bike-sharing program as successful examples, most have not experienced the breadth of innovations familiar to avid cyclists, transportation planners and engineers who are continually studying how to improve active transportation networks in the city.
The Chaddick Institute fashioned an hour-long cycle ride covering a seven-mile route through downtown Chicago that provides rich insights into the city’s remarkable evolution and transformation in bicycle infrastructure. Riding this loop illustrates why Bicycle Magazine awarded Chicago “Best Bike City” in 2016 and draws attention to major shifts in transportation planning that are reshaping how we get around. Click the numbers on the map–which also correspond to the numbers referenced in the blog–to get additional information for each point of interest.
SETTING THE SCENE
Start your tour at the Divvy bike-share station at Adams & Wabash (1) and head down Jackson Blvd toward the Lakefront Trail (2), which is properly regarded as “first generation” modern bicycle infrastructure. Dedicated in 1963, the more than a half-century old trail is akin to a bicycle highway, hugging Lake Michigan’s shoreline and buffering riders from the nearby highway congestion (3). The Navy Pier flyover bridge (4) promises to enhance movement along this famously congested trail by allowing pedestrians and cyclists uninterrupted travel over its entire 18.5-mile span.
The potential for cycling along Chicago’s waterways is evident as you head east through the Riverwalk gateway (5) along the river’s main stem. Although the newer (2016) landscaping and street furniture along this segment (6) of the Chicago River are enticing for pedestrians, the right angled turns, narrow pathways and infrequent exit/entrance ramps make for a less desirable cycling experience. Now, zig-zag up the “riverbank” toward Wacker Drive.
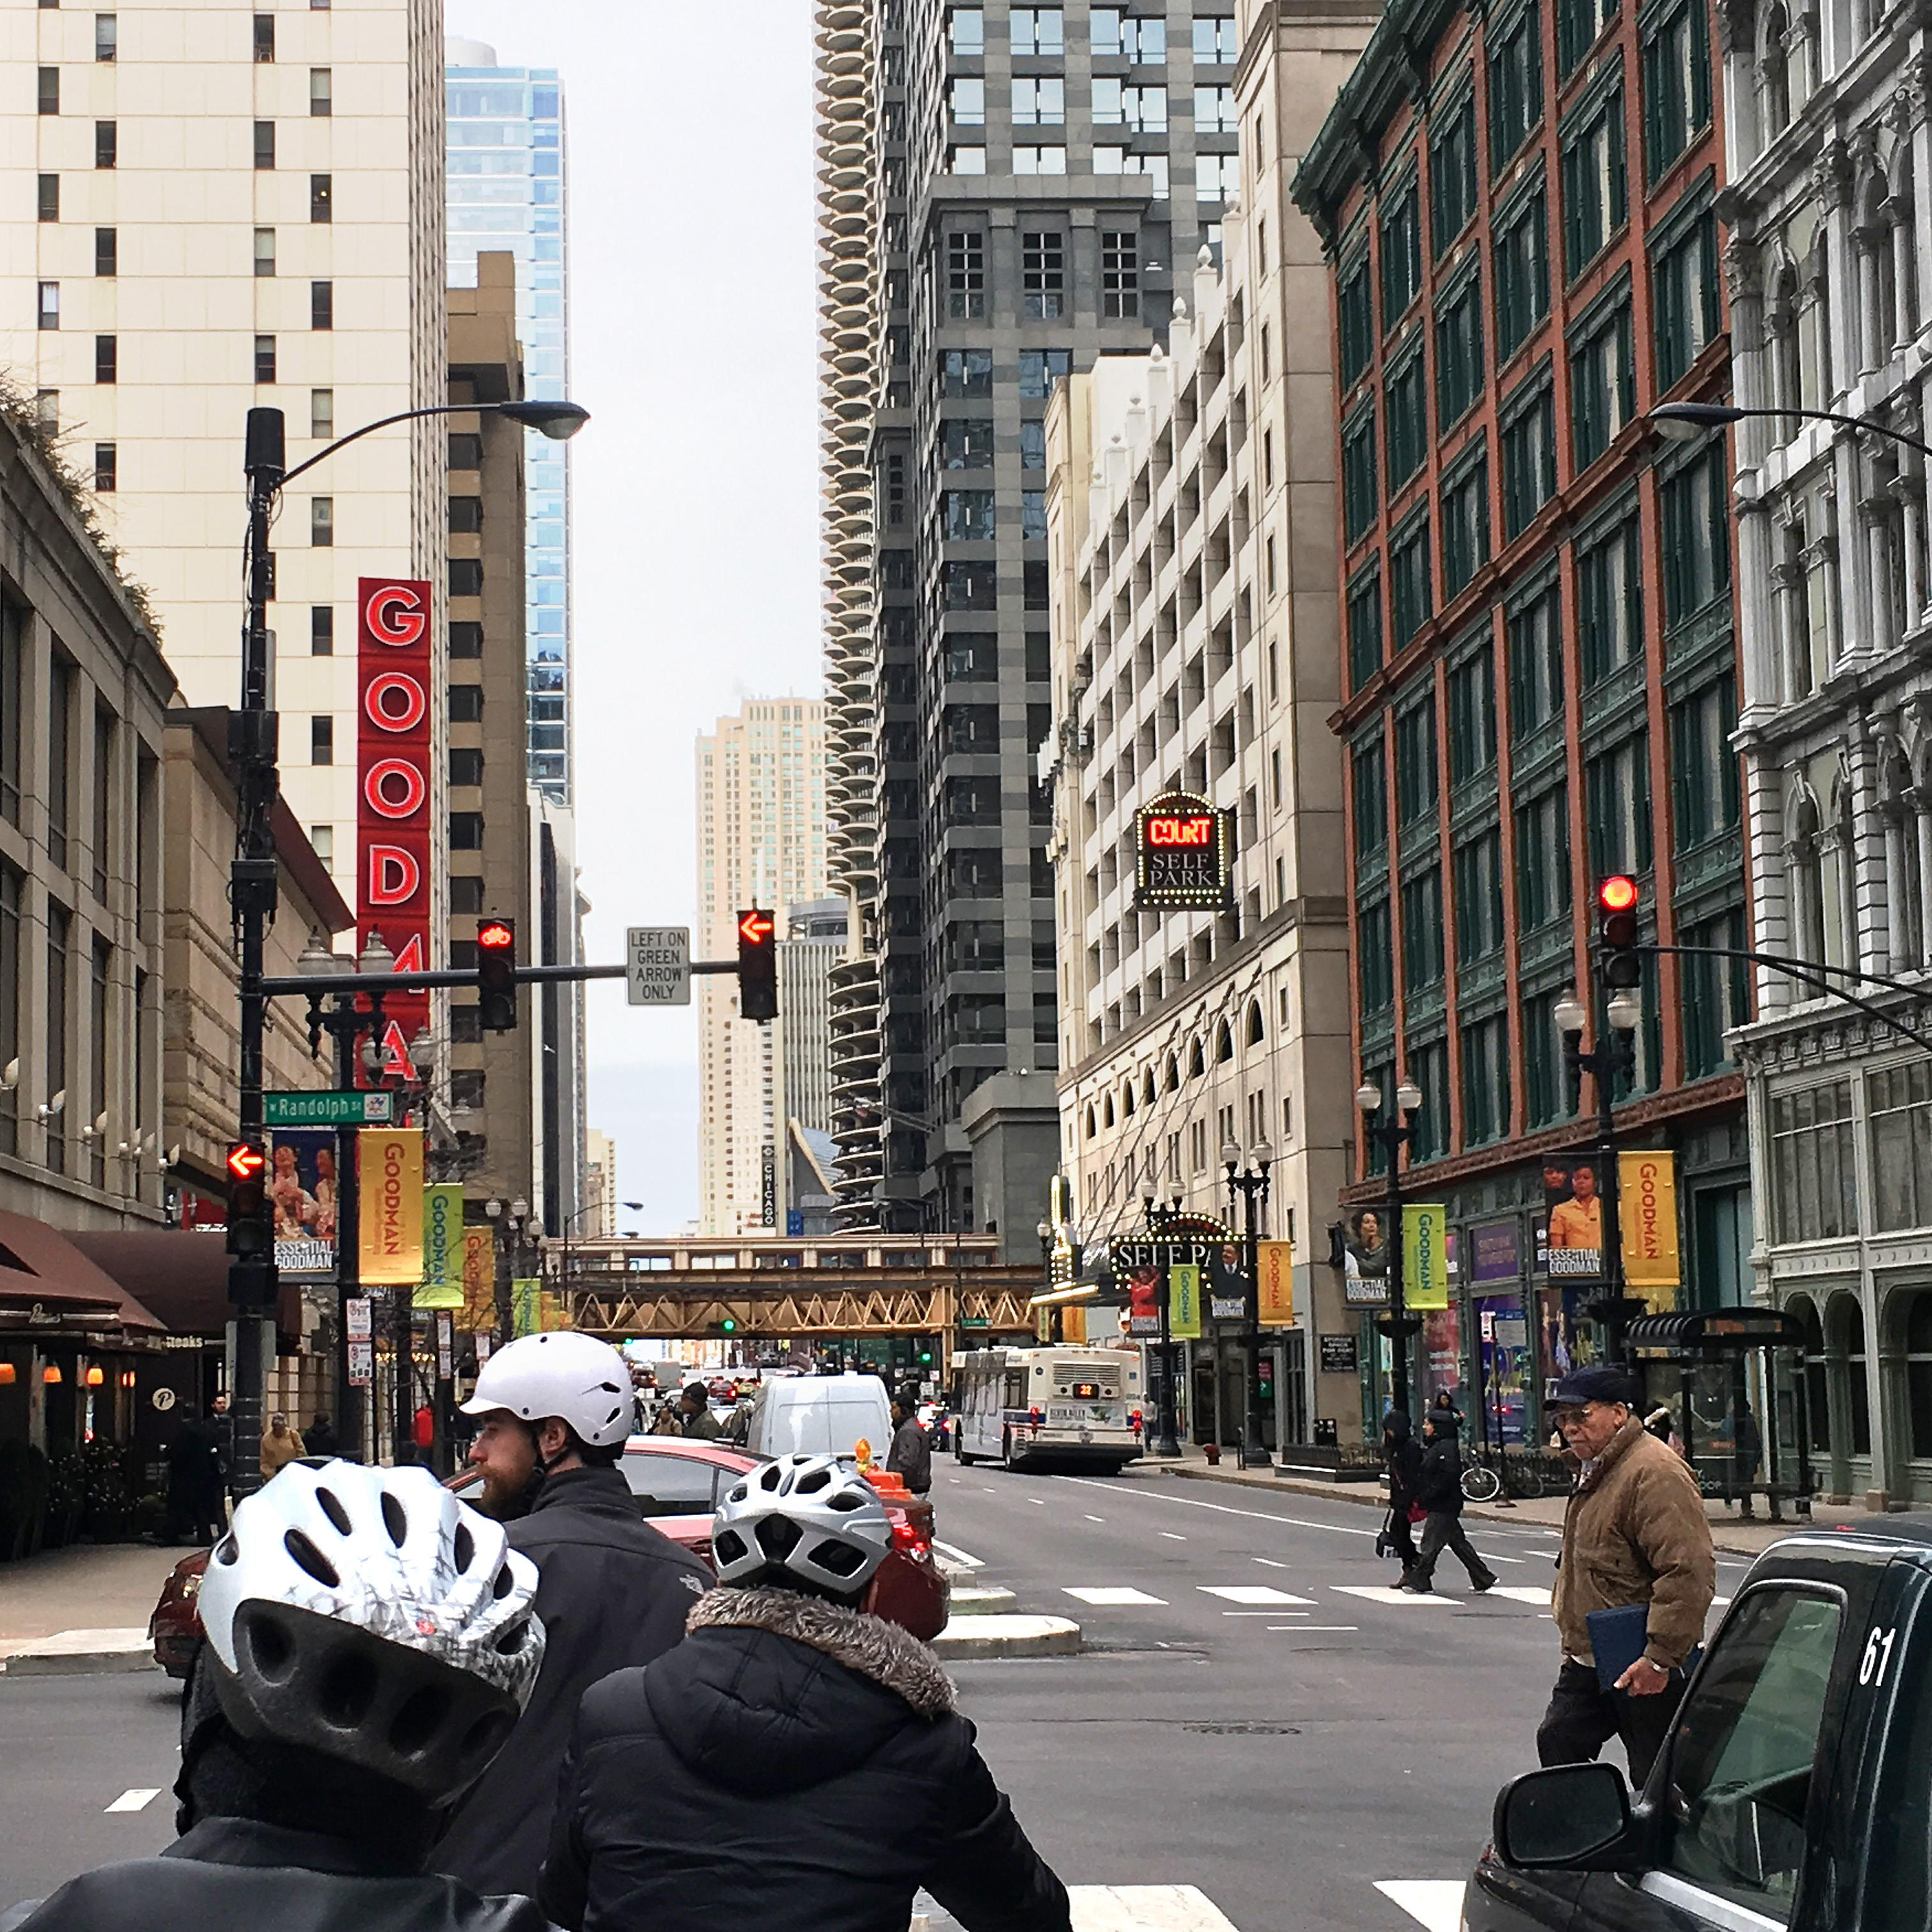
Our group heading north on Dearborn St at the Randolph intersection. (Photo credit: Ahmad Feizi & Riley O’Neil)
Back on street left, a compelling picture of contemporary urban cycling emerges in the form of the new barrier protected bike lane (or cycle track) along Randolph Street (7). Finished in 2016, the Randolph Street redesign—complete with bicycle traffic signals (8)—is the most recent among similar protected paths constructed through the heart of the city, including those on Clinton (2015), Washington (2015) and Dearborn (2011).
The culmination of Chicago’s active transportation infrastructure is asserted in the Dutch-inspired protected intersection at the corner of Washington and Franklin (9). Developed as part of Chicago’s Loop Link project (10), the intersection features mode-specific colored pavement (green for bicycle, and red for bus) as well as concrete islands and curbs that shield both pedestrians and cyclists from turning vehicles. This urban bikeway design—derived from guidelines promoted by NACTO—reduces conflicts between different transportation modes and has caught on in other cities around the country including San Francisco, Austin, and Atlanta.
As you move through this well-integrated system—including a stage turn at LaSalle and Washington (11), a colored zone in the intersection created to enhance the safety of turns for cyclists—remember that the reconfiguration of public rights-of-way to support bicycling marks a return to “mode mixing” on streets not seen since the early twentieth century, when horse-drawn carriages and streetcars were part of the mix. Again, steer west onto Randolph Street beneath the Metra viaduct (12) and head north on Clinton toward Milwaukee Ave–dubbed the “Hipster Highway”–the highest volume cycling route in the city.
(At this point you are about halfway through the tour. If you are using a Divvy bike, remember that trips over 30 minutes cost more. Consider exchanging your bike at the Clinton and Lake Divvy station. The map above shows all 28 Divvy stations within 500 feet of the seven-mile route.)
LEARNING BY SEEING
The next phase of the ride offers evidence of a dramatic shift from planning primarily for recreational riding on the city’s edge to planning for commuting and personal business downtown. For example, new cycling facilities—such as the bike or queue boxes (13) at the intersection of Kinzie, Desplaines and Milwaukee—put cyclists at the head of traffic lanes, making them more visible to motorists and allowing them to get ahead of queuing traffic. At peak travel times, you will see a continuous flow of bicycle commuters moving efficiently through Kinzie’s protected bike lane (14), providing them door to door convenience, and avoiding the hassle of waiting for buses and trains or sitting in traffic. Traffic signals on southbound Wells Street—another popular commuter route (15)–are timed so that Loop-bound bicycles traveling at an average speed of 12 mph will encounter a series of green traffic lights (the “Green Wave“) from Huron to Wacker.
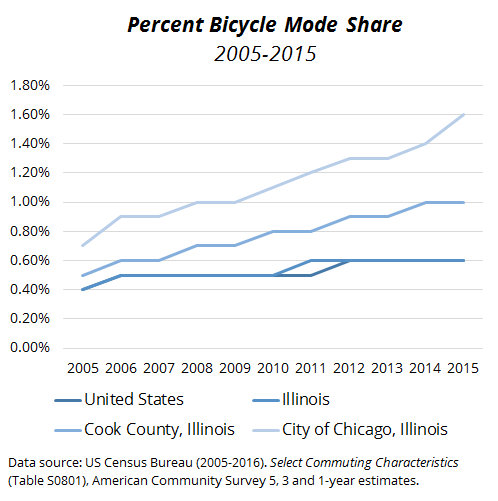
Between 1990 and 2005, the proportional share of commuter trips by bicycle in Chicago and most of the country was relatively flat. Since 2005, Chicago has experienced an impressive 129% growth in bicycle commuters, which likely underestimates the overall growth in active transportation within the city. Much of the credit for this recent upswing in cycling belongs to the city’s Streets for Cycling Plan 2020 (adopted 2011) which charted a vigorous course for bike commuting. According to David Smith, Senior Planner at the Chicago Department of Transportation, cyclists account for 20-30% of all traffic on many of the city’s most-improved bicycle corridors.
Now turn left off Randolph and head south on the Clinton Street bikeway. The protected cycle path forms critical connections to the city’s bus and commuter rail terminals including Ogilvie and Union Stations (17). Paths along both Clinton and Dearborn Street (19) allow for contra-flow cycling or travel in opposite directions. Such a design is new for Chicago and poses potential conflicts between pedestrians and cyclists, hence the on-pavement signage that cautions pedestrians to look both ways before crossing (16). Urban cycle networks are most effective when integrated with well-designed pedestrian facilities (21).
End your ride at the Federal Plaza Divvy Station on Adams Street (20). In only seven miles of downtown Chicago, you’ve now seen first-hand the benefits of investments that support urban cycling. A group of researchers from Western Michigan University’s transportation center we guided on this exact ride saw this as well. Of course, Chicago’s bicycle system can be inconsistent (e.g., buffered path along Harrison [18]) and, in several places, incomplete. But it is easy to appreciate–and see with your own eyes–how downtown Chicago has made cycling a centerpiece of many modern transportation initiatives.
We are excited to unveil a new blog by the Chaddick Institute for Metropolitan Development at DePaul University. Chaddick Insights is a platform for analyzing issues and trends – and ultimately fostering discussion – about contemporary urban planning, transportation, and design.
Our first blog post, written by Chaddick Assistant Director, Scott Smith, focuses on the remarkable bicycling infrastructure that continues to emerge in our city’s downtown. We hope you’ll leave us a comment or question to get the discussion going – just be sure to stick to our blog etiquette guidelines, below!
Do’s & Don’ts
DO leave us a comment or pose a question related to the blog post. We’ll be sure to respond in a timely manner! DON’T use offensive or antagonistic language in your comments. We reserve the right to ban repeat-offenders. DO share Chaddick Insights posts with friends and colleagues via email or social media. DO email us to suggest a topic or if you’d like more information on a specific post.