By C. Scott Smith, Assistant Director, Chaddick Institute, and Riley O’Neil, graduate student
One of the major advantages of living in Chicago compared to other US cities is having access to a broad range of transportation options. The proximity of homes and workplaces to public transportation routes has contributed greatly to the success of Chicago’s transit system, which now handles about 600 million passenger trips each year. We estimate that 1.1 million (close to 100% of total) workers and 1.3 million (about 98% of total) jobs in Chicago are within ½ mile of a bus stop or rail station.
For people with disabilities, however, access to public transportation can be limited. Chicago’s enormous system of commuter rail lines, elevated rail/subways, and bus routes—not to mention other “shared use mobility services” such as e-scooter sharing, bikesharing, carsharing and ridesourcing (via Uber and Lyft, for example)— do not always accommodate people who experience disability situations (e.g., passenger traveling via wheelchair or with stroller attempting to access transit via train station without an elevator). This blog summarizes key accessibility gaps working people with varying abilities face in Chicago’s public transportation system.
Accessibility of Chicago’s rail stations
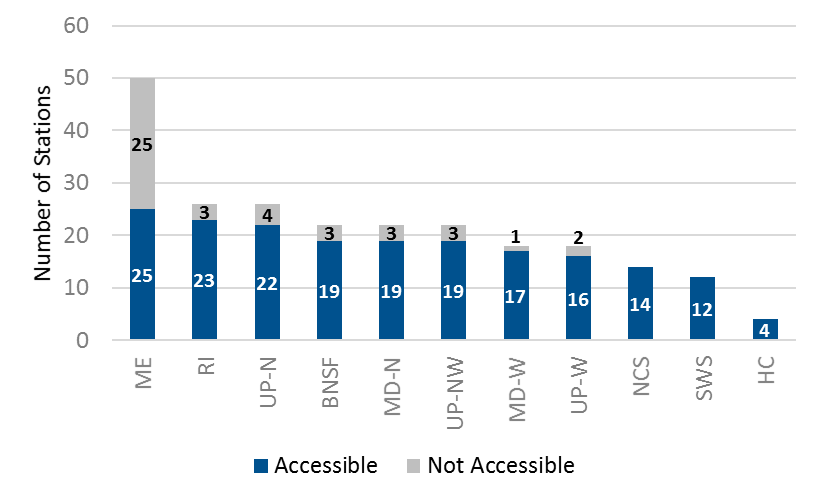
A simple way to gauge access for people with varying abilities is to tally the share of rail stations that fail to accommodate people with mobility limitations. Presently, close to 20 percent (192) of all Metra commuter rail stations (239) and 33 percent of all ‘L’ stations are not fully accessible, or do not support wheelchair boardings. The following figures show the proportion of stations for each Metra and Chicago Transit Authority ‘L’ line that is (not) accessible. On Metra, only three of the eleven commuter lines offer full accessibility and only half of the stations on the Metra Electric, in particular, have facilities that accommodate people in wheelchairs. On the CTA, access on the Brown, Green, Pink and Yellow Lines is much better than that on the Red and Blue Lines.
Proportion of CTA ‘L’ Stations that are Wheelchair Accessible by Line

Proportion of Metra Stations that are Wheelchair Accessible by Line
This is not to say that these major transit operators have not taken steps toward making their infrastructure more accessible. According to CTA, when the Americans with Disabilities Act (ADA) passed in 1990, only 6 percent of the agency’s rail stations complied with the legislation’s design standards; efforts by the agency over the past several years have grown this number to 67 percent. Further, just last year the CTA announced its All Stations Accessibility Program (ASAP), which aims to make the entire rail system accessible by 2036. However, such changes could not come too soon for many of the area’s visitors and residents with physical, cognitive and sensory limitations who experience difficulties traversing by private automobile; which is still the dominant mode of travel within the Chicago region.
Working age people experiencing disability
Making the transition toward a regional ADA compliant public transit system is especially important for Chicago’s working age population experiencing disability. Recent census data indicates that about 53.5 percent of people who have self-identified in the census as having limited mobility in Chicago are of working age; that is, between 18 and 64 years old. And while nearly 50 percent of people with disabilities over 25 years of age have at least some college education, only 19.1 percent are employed and only 24.7 percent participate in the labor force. Further, more than half of workers reporting a disability worked less than full time (compared to 34.2 percent for their counterparts who reported no such limitation) and earned 30 percent less than those who did not report a disability (American Community Survey, 2015).
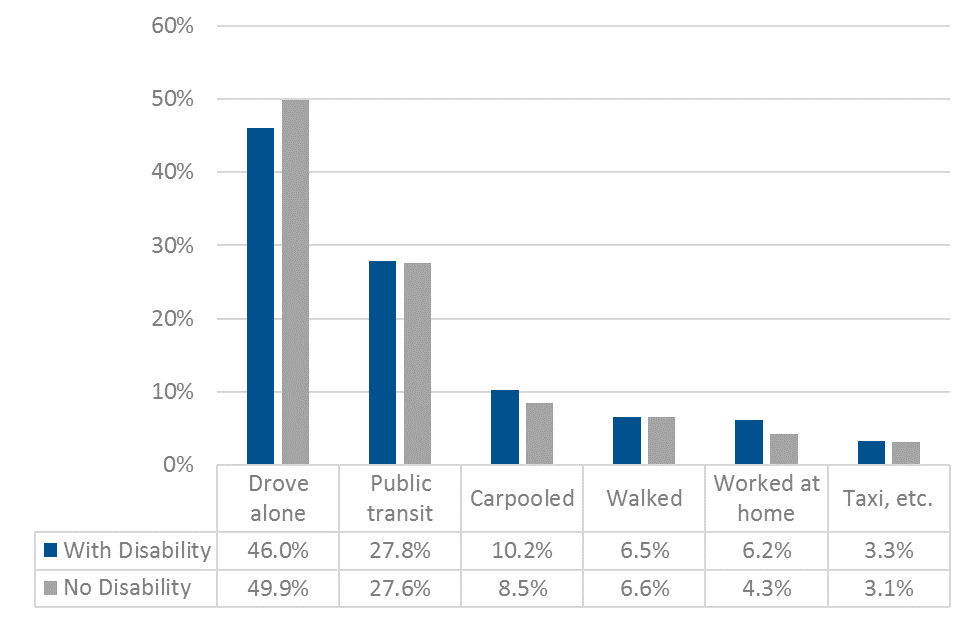
Previous research has shown that public transit is an important way to improve labor force participation among people with disabilities in part because it tends to be more affordable and accessible than other modes, especially private automobile. For adults with disabilities, lack of adequate transportation is one of the most frequently cited reasons for being discouraged from looking for work. As the table below shows, people with mobility limitations in the City of Chicago tend to use shared modes (such as public transit, taxi and carpool) more than other workers, albeit slightly. People with mobility limitations also work from home more than those who reported no such limitation.
Estimating public transit employment accessibility for people with limited mobility
I used a variety of data sets to identify public transit accessibility gaps for working people with mobility limitations in the Chicago area. Most important were the public transit routes and schedules derived from general transit feed system or GTFS datasets provided by the three major service operators, Metra, CTA and Pace Suburban Bus. (It should be noted here that Pace’s GTFS data do not include information about wheelchair accessibility so, for simplicity sake, we assume that all 23,457 Pace bus stops in the dataset accommodate wheelchair boarding.) Employment distributions for all 2,014 census tracts in the metropolitan Chicago area were made available from the US Census Workplace Area Characteristics Longitudinal Employer-Household Dynamics dataset.
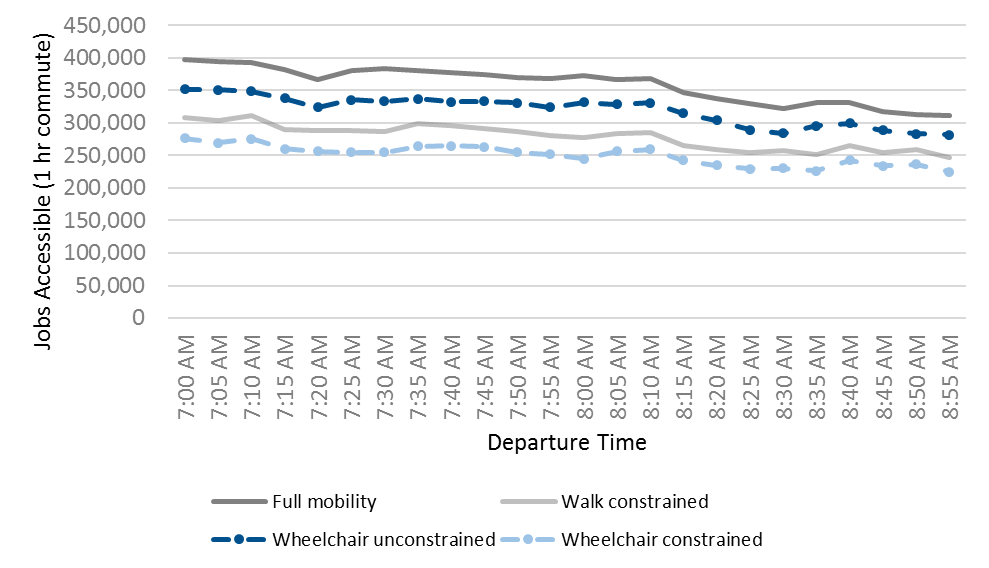
The employment accessibility estimates calculated as part of this research were also evaluated with respect to four scenarios, each representing a unique commuter mobility profile that is sensitive to maximum desired walking distance, average walking speed and whether commuters require wheelchair boarding accommodations. The estimates correspond to the average number of jobs that can be reached in a one hour journey during the peak morning commute period (i.e., 7AM-9AM at five-minute departure intervals) for each of the below profiles across Chicagoland.
| Scenario | Assumptions |
| Full mobility | Worker walking at 3 mph pace a distance of up to one mile |
| Walk constrained | Worker walking at a slower 2.1 mph pace up to ½ mile |
| Wheelchair unconstrained | Worker with wheelchair traveling at a 3 mph pace of up to one mile |
| Wheelchair constrained | Worker with wheelchair traveling at a slower 2.1 mph pace up to ½ mile |
The figure below shows that merely being constrained by the speed and distance in which one can walk can substantially reduce the number of jobs that can be reached. The walk constrained model reduces average job accessibility by 22.3 percent, while the lack of wheelchair reduces it by 30 percent. Clearly, as mobility becomes more constrained, job opportunities dwindle. Making matters worse, the number of jobs reachable diminishes for all transit users when you are not traveling during. This is especially problematic for mobility constrained individuals who are more likely to work part time, have flexible hours and, therefore, may not always benefit from the higher frequency public transit services during the morning and evening rush.
The average percentages I provide above are for the morning peak period. To show this variability across different times of day, I created an animation comparing job accessibility for the full mobility and wheelchair constrained scenarios mentioned above starting at 7AM from the close-in community of Forest Park. This animations shows the job areas that commuters can reach by walking and using all types of public transit in a one-hour period.
This animation shows the job areas reachable within an hour by a fully mobile worker (shown in blue) and wheelchair constrained worker (shown in orange) by public transit. This difference in number of jobs reachable is often more than 100,000 depending on departure time.
Fortunately, there is growing awareness that our present transportation system is inadequate for a growing share of the population. Station/stop improvements, assistive technologies, Universal Design, Complete Streets and travel training are just a short list of efforts that are improving pathways to transit access for all people. Check back in a few months as we report more results on this issue. I welcome comments on this blog post, our first on this topic!
It’s too bad to check your article late. I wonder what it would be if we met a little faster.
I want to exchange a little more, but please visit my site and leave a message!!
제이나인 온라인 카지노 먹튀
제이나인 해외 온라인 카지노
제이나인 온라인 카지노 사이트 추천
제이나인 안전한 온라인 카지노
제이나인 온라인 카지노 조작
https://www.j9korea.com
I’m curious why the red and blue lines are less accessible (thus far) than the other CTA lines. Because people with disabilities are more likely to have non-traditional work schedules, I would have guessed the red and blue lines would be the highest priorities for updates because they run 24 hours. Perhaps these stations are more difficult to make changes to or don’t serve as many people as the others?
Really interesting, Scott. Would also be interesting to see accessibility data by neighborhood. Can we access that 1-hr transit commute animation to share?